The following data and its limitations are more thoroughly explained in the full report. There are two important points for the community to consider when exploring the data presented below.
1) Identities: The University of Virginia uses the Integrated Postsecondary Education Data System (IPEDS) categorizations of race, as well as binary definitions of gender, when reporting data. The Honor Committee recognizes the limitations of these definitions and currently collects more flexible, self-reported data from students. Comparisons of Honor Committee data to UVA population data necessitate the use of IPEDS categorizations.
2) Sanctioning: The data below draws distinctions between the various outcomes of reports received by the Honor Committee. Once reported, a student may make an Informed Retraction (IR), resulting in a two semester leave of absence from the University. If a student forgoes an IR, the case proceeds to an Investigation Panel (I-Panel). The I-Panel determines which cases are sent to a hearing. If a student is found guilty at a hearing, they are permanently dismissed from the University. Students may permanently Leave the University Admitting Guilt (LAG) or request a hearing for Contributory Health Impairments (CHI), previously termed "CMD", at almost any point prior to a hearing.
For the purposes of this page, and unless otherwise specified:
- Variations of the term "dismissed" specifically refers to all students who permanently left the University admitting guilt (LAG) or were found guilty at a hearing
- Variations of the term "sanctioned" more broadly refers to all students who were sanctioned in any way including the Informed Retraction (IR), guilty verdicts at hearings, or permanently leaving the University admitting guilt (LAG)
- Variations of the term "no-sanction" broadly refers to all dropped cases, not guilty verdicts, and cases resolved through the CMD process.
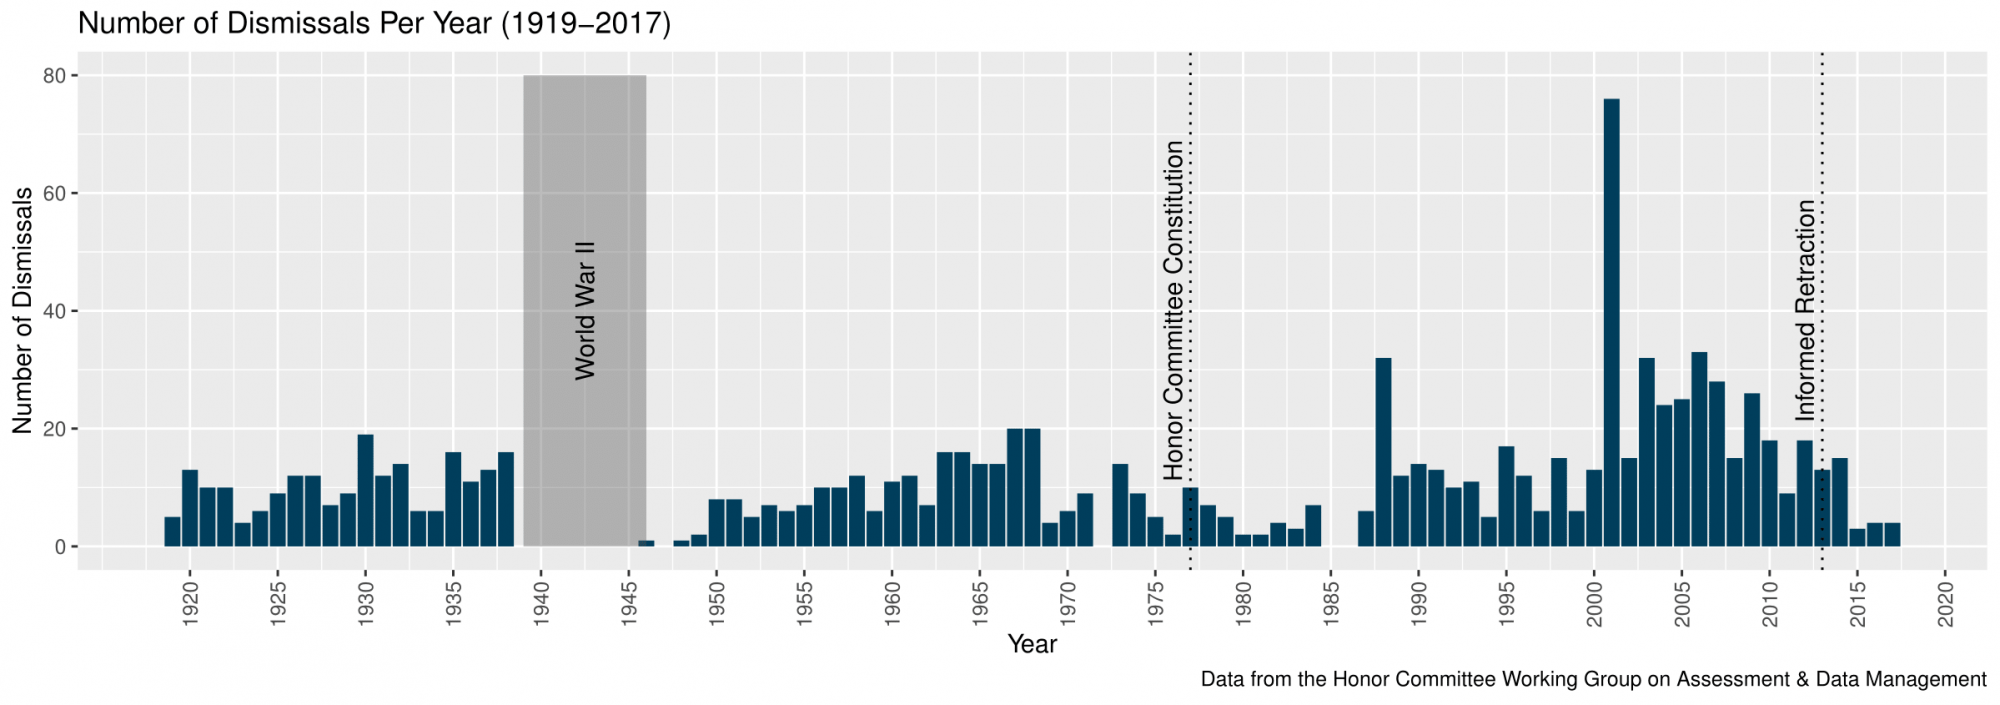
1. The number of dismissed students per year varies over time.
From 1919-2017, 1104 students were sanctioned by the Honor System. The significant spike in number of dismissals in 2001 comes from an influx of reports from a single class, the "How Things Work" cases. In 2001, the professor for the introductory physics class "How Things Work" created an algorithm designed to flag sections of papers submitted for his class that were substantially similar. The professor discovered a large number of identical passages and reported over 100 cases in a single year. As a result of those cases, 48 students were found guilty at a hearing or left admitting guilt. [1]
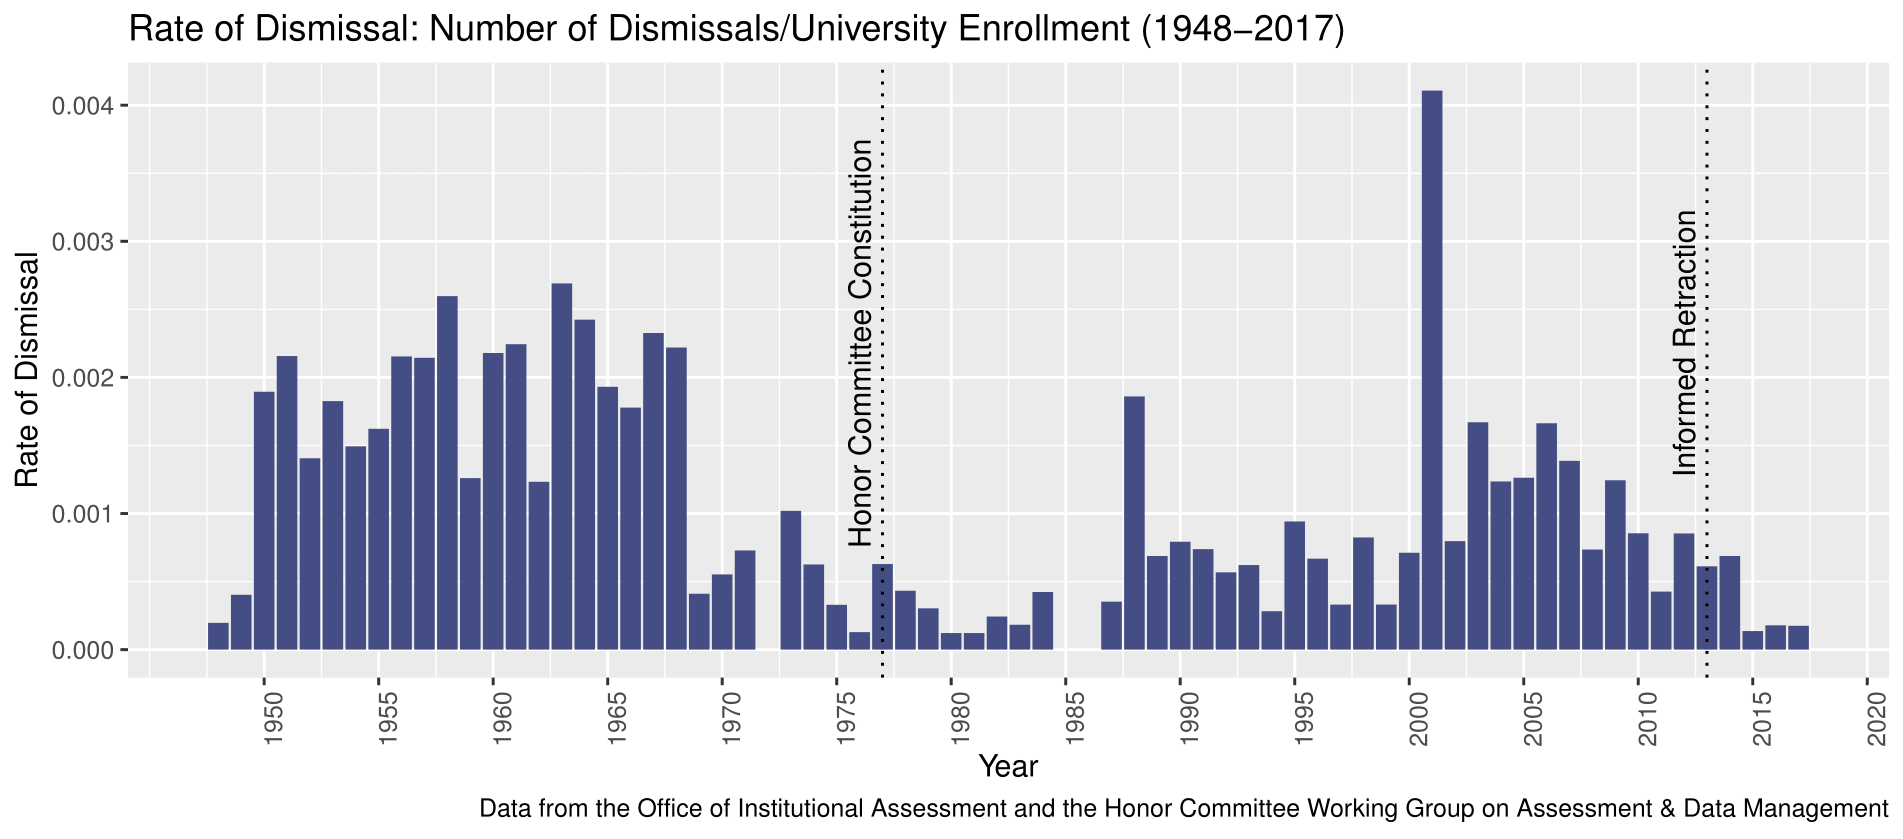
2. The per capita dismissal rate was highest from 1950 to 1970.
Between 1950 and 1970, the dismissal rate hovered around 0.2% of enrolled students, then declined sharply in the 70s and 80s, and was higher in the 2000s. The data shows a significant drop in dismissal rates from 1970 to 1986, though it's possible data is missing or was poorly recorded. The 2000s show an increase from the 1990s. 2014 to 2016 have a significantly lower dismissal rate because of the introduction of the Informed Retraction.
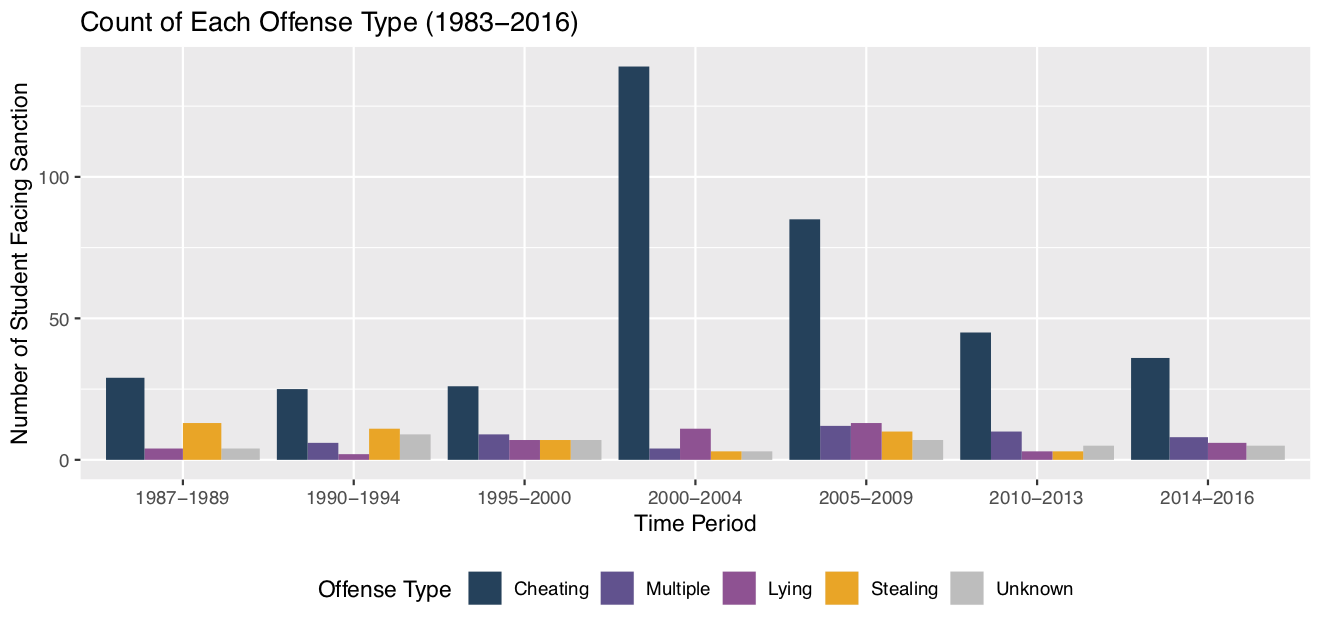
3. Cheating is the most commonly sanctioned offense.
Since 2000, more than 65 percent of sanctioned students were reported for cheating. The period from 2000-2004 had a much higher proportion of students sanctioned for cheating (student sanctioned for cheating made up 87 percent of all sanctions) due in part to the large number cheating reports received from 'How Things Work'. Still, recent years have seen a higher proportion of sanctioned cheating cases, relative to the number of cheating reports, than in the past. The number of sanctioned cheating cases from 2005 to 2016 was higher than from 1990 to 1999. Sanctions for cheating were also a larger proportion of all sanctions (67 percent from 2005-2016, compared to 42 percent from 1990-1999). Cases where students were sanctioned for multiple offenses typically had cheating as one of the offenses.
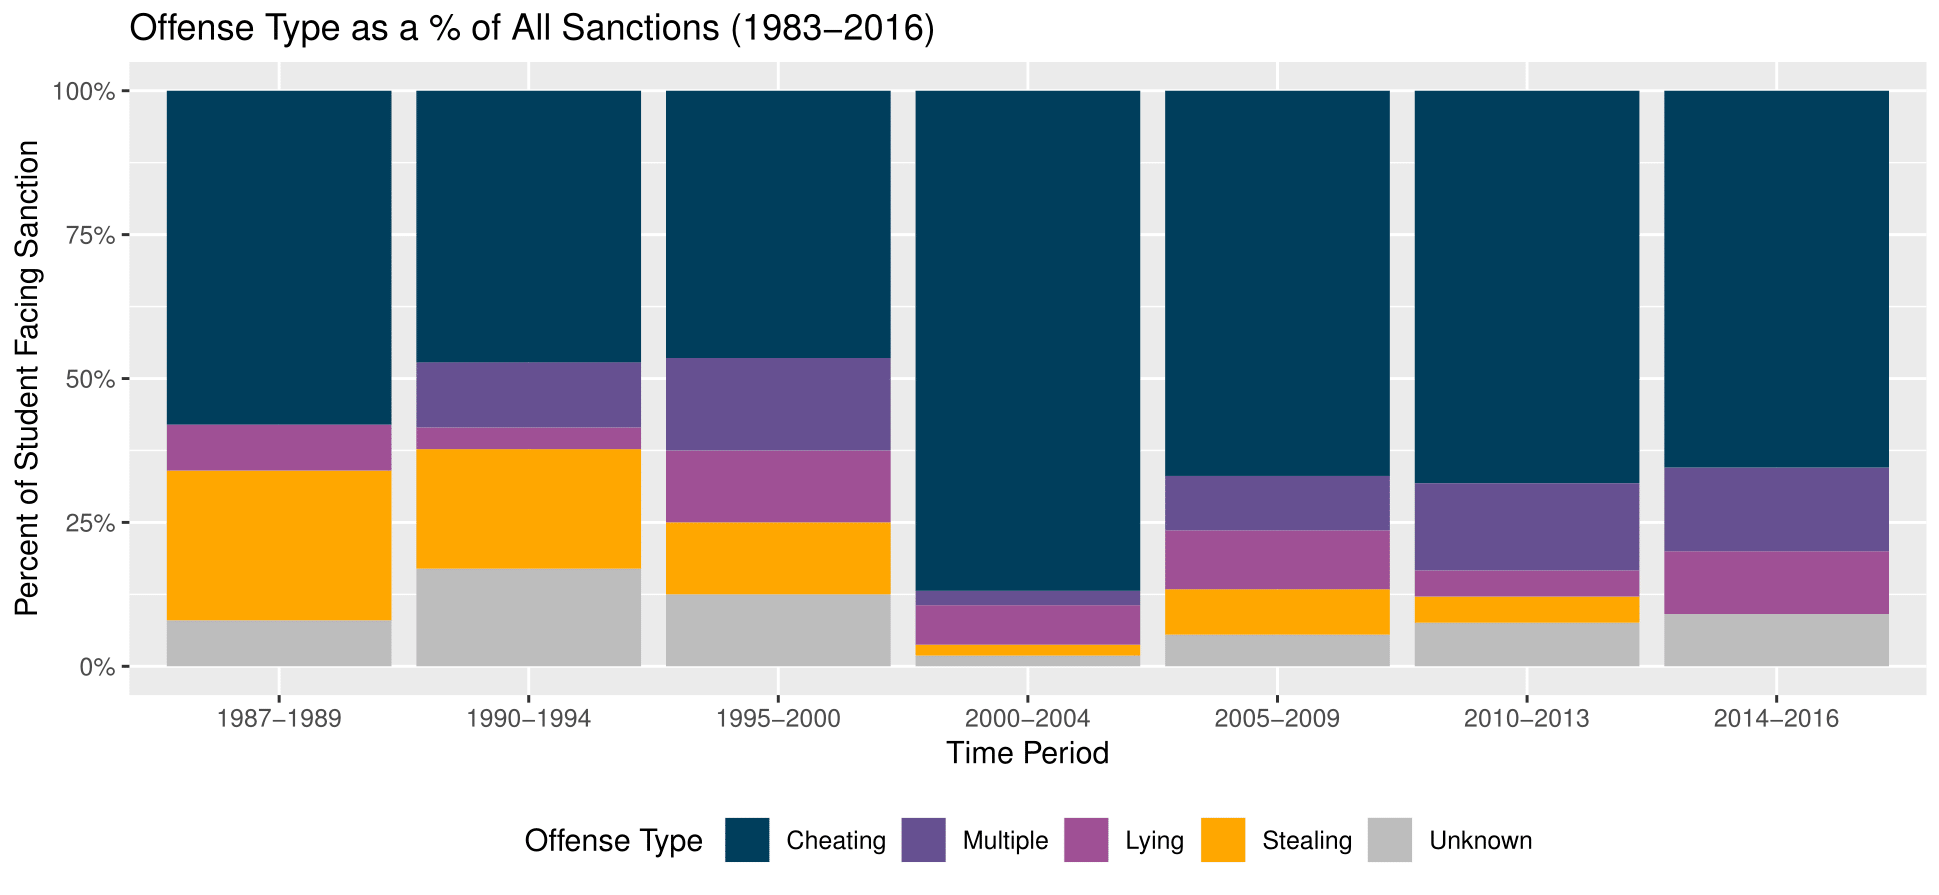
4. The number of sanctioned stealing offenses has declined.
From 2000-2016, stealing cases were a much lower proportion of total cases for which students faced a sanction than they had been from 1987 to 1999. From 1987-1989, stealing cases were 26 percent of all sanctions. From 2010-2016, stealing cases were only 2 percent of all sanctioned offenses.
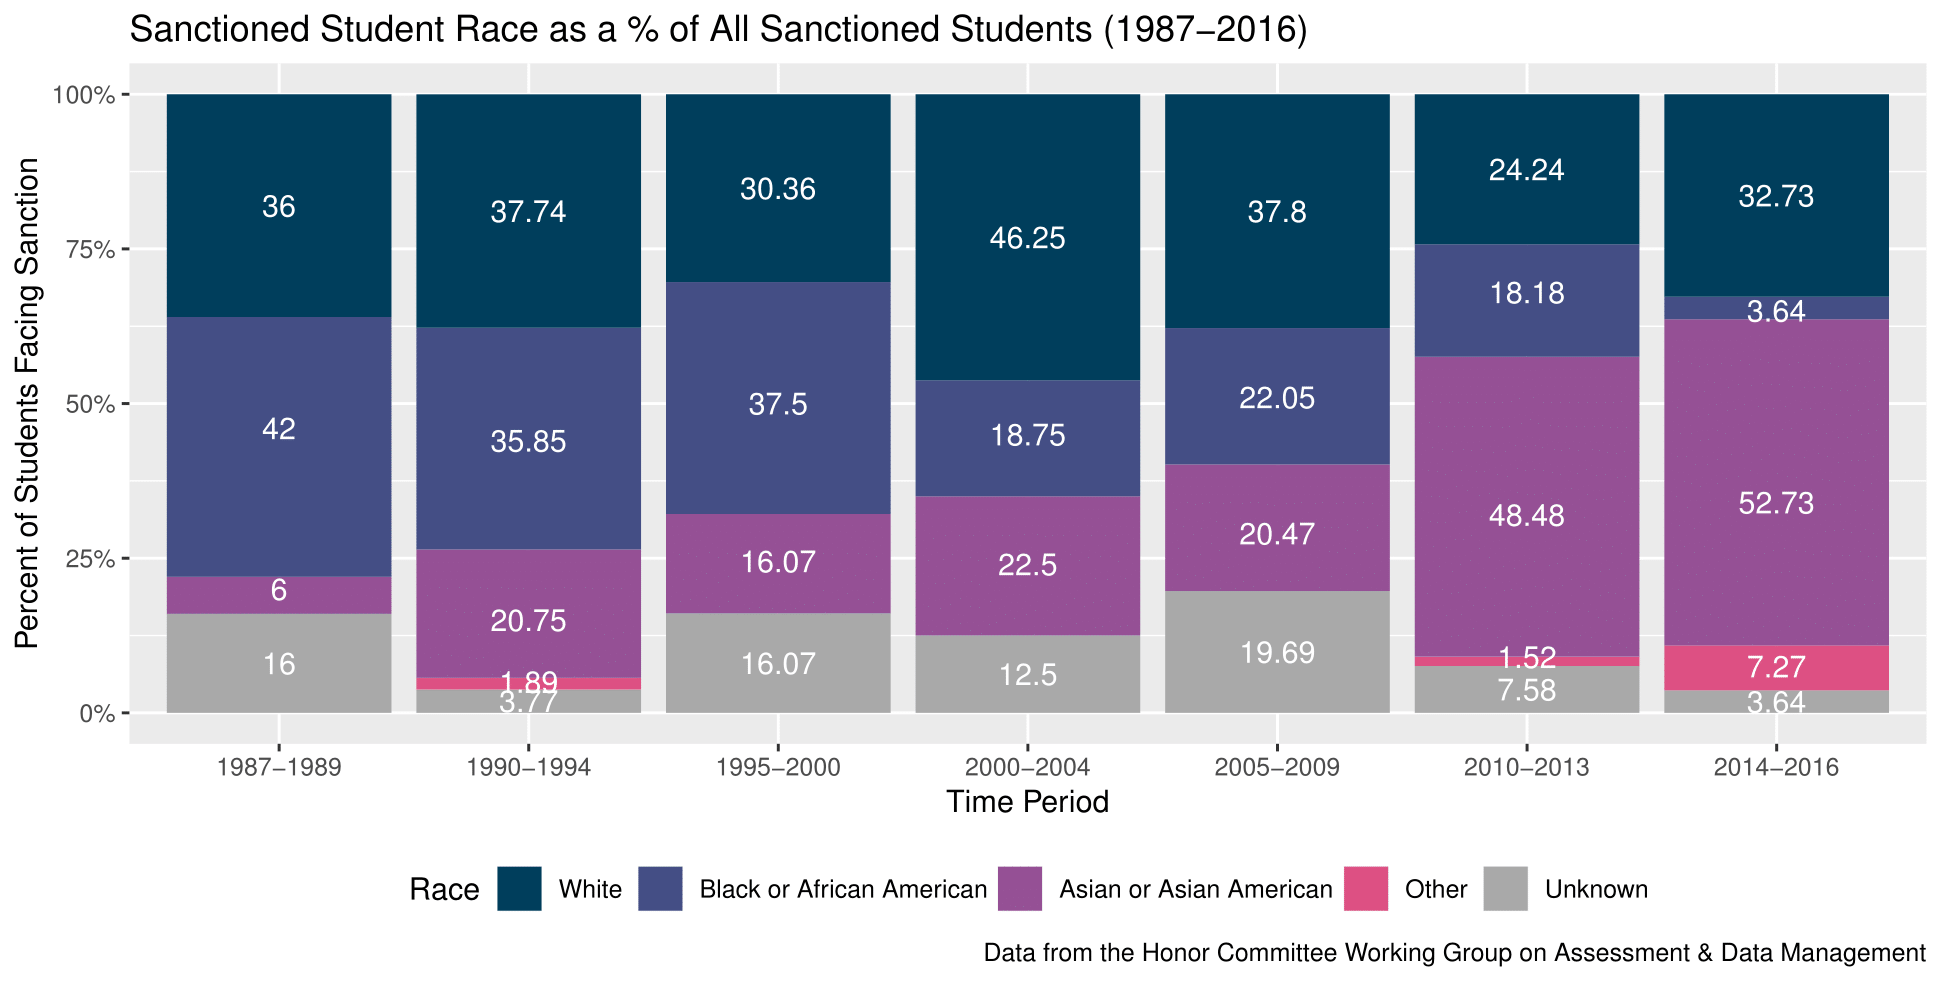
5. The demographics of sanctioned students have changed.
From 1987 to 2009, Black or African-American students faced sanction at a rate that was significantly disproportionate to their population at the University. From 1987 to 1989, Black students made up 41 percent of all students dismissed from the University (dismissal and leaving admitting guilt were the only possible sanctions during at this time). Comparatively, Black students made up only 9 percent of University students in 1991, the earliest year for which data was available. From 2010 to 2016, Black students made up only 12 percent of sanctioned students. The proportion of sanctioned students who are Asian or Asian American has increased over the past thirty years. Asian students made up 6 percent of students dismissed from the University from 1987 to 1989, but made up 50 percent of students sanctioned from 2010 to 2016. Many of the Asian students in our data were international students, which may contribute to the significant disproportionality.
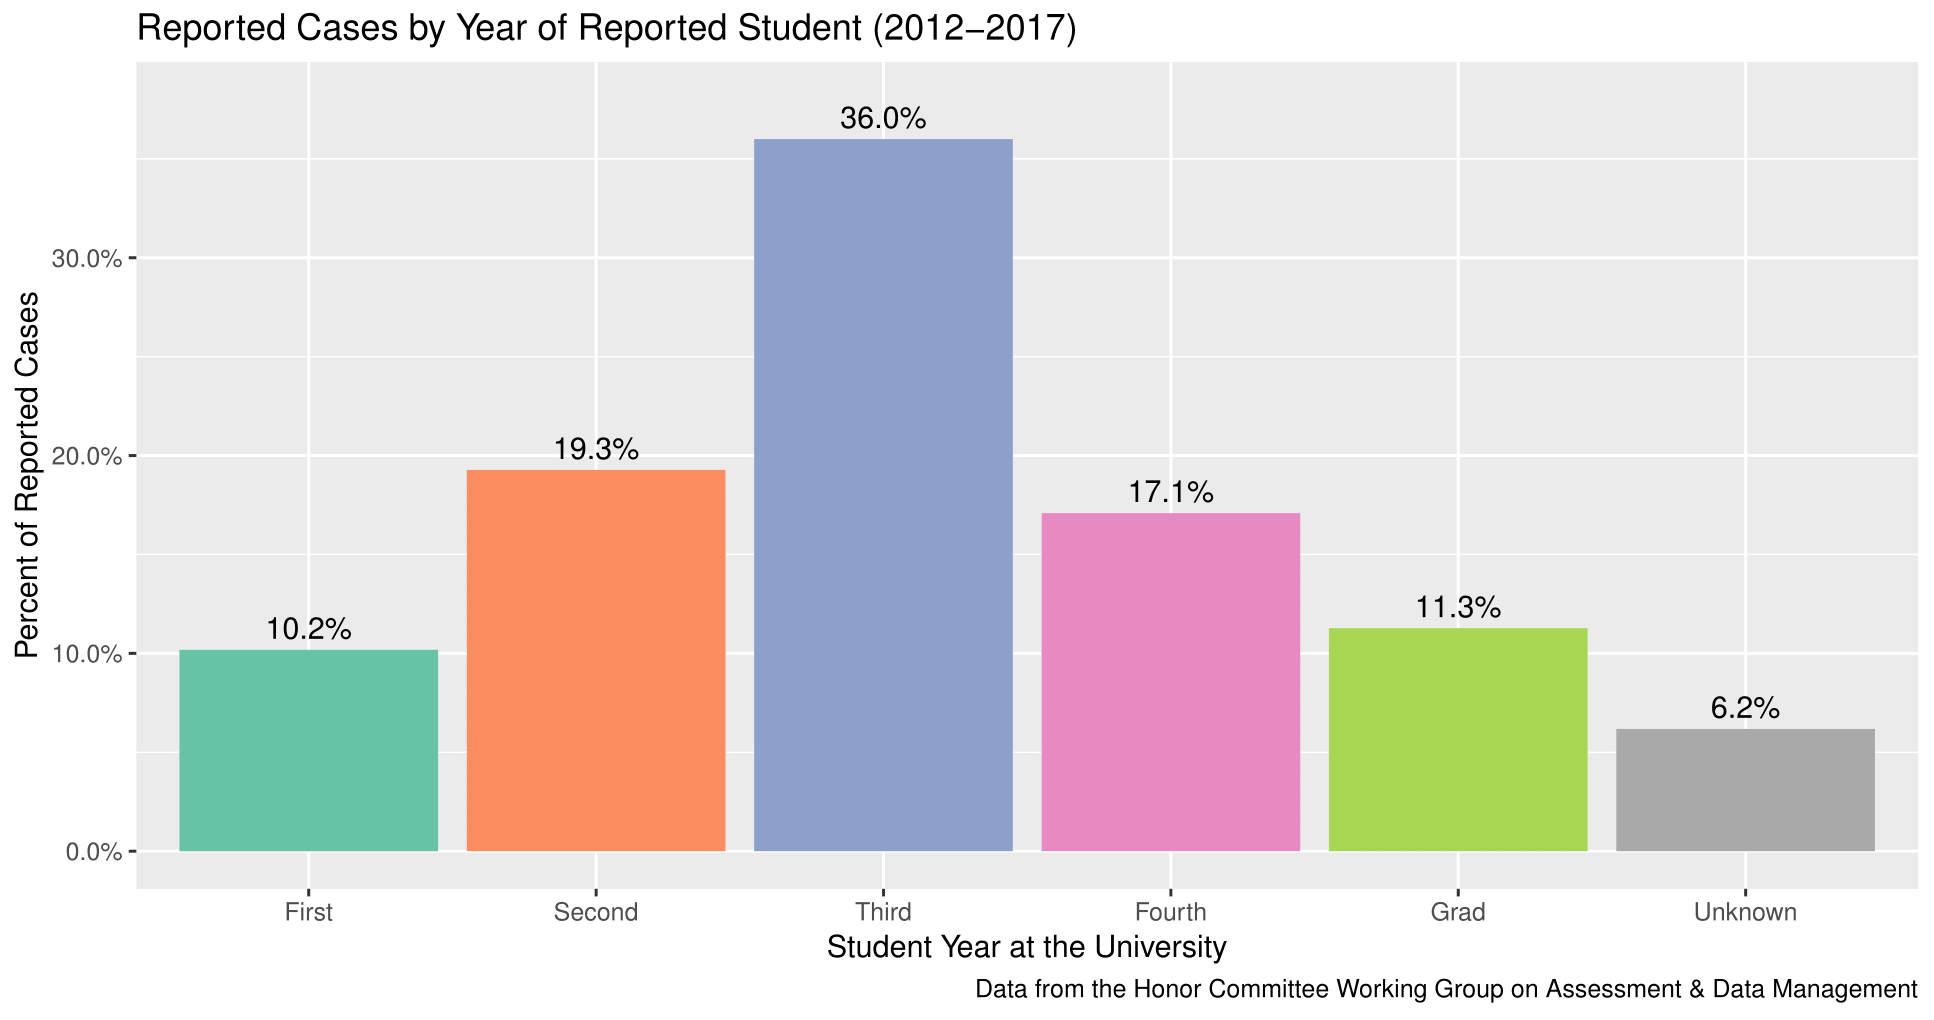
6. Reports are unequally distributed across student class years.
Third year students make up the highest proportion of reported students, at around 36 percent. Second year students follow at 19 percent, fourth year students at 17 percent, and first year students at 10 percent. Graduate students were 11 percent of all cases, and about 6 percent of cases have year unknown.
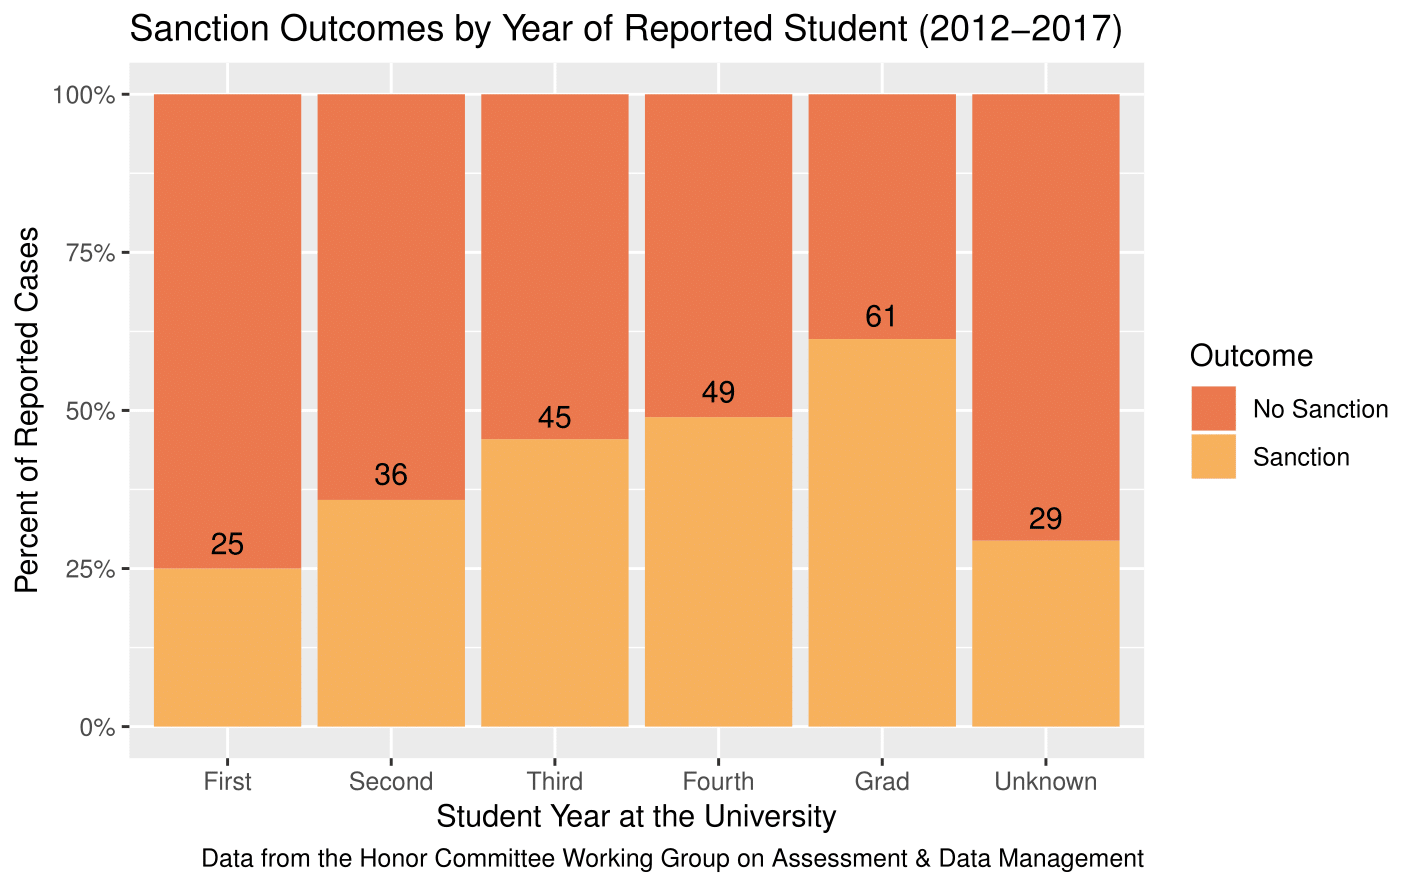
7. Higher year students reported to the system were more likely to be sanctioned than lower year students, relative to the number of reports received for students of the same year.
First year students faced a sanction in 25 percent of all cases, the lowest frequency across all years. Graduate students faced sanction most frequently, with 61 percent of graduate student cases ending in sanction. Second year students received a sanction 36 percent of cases, third year students in 45 percent of all cases, and fourth year students in 49 percent of all cases. Higher year students were also more likely to make an Informed Retraction. Accordingly, graduate students are the most likely to be sanctioned and most likely to make an Informed Retraction.
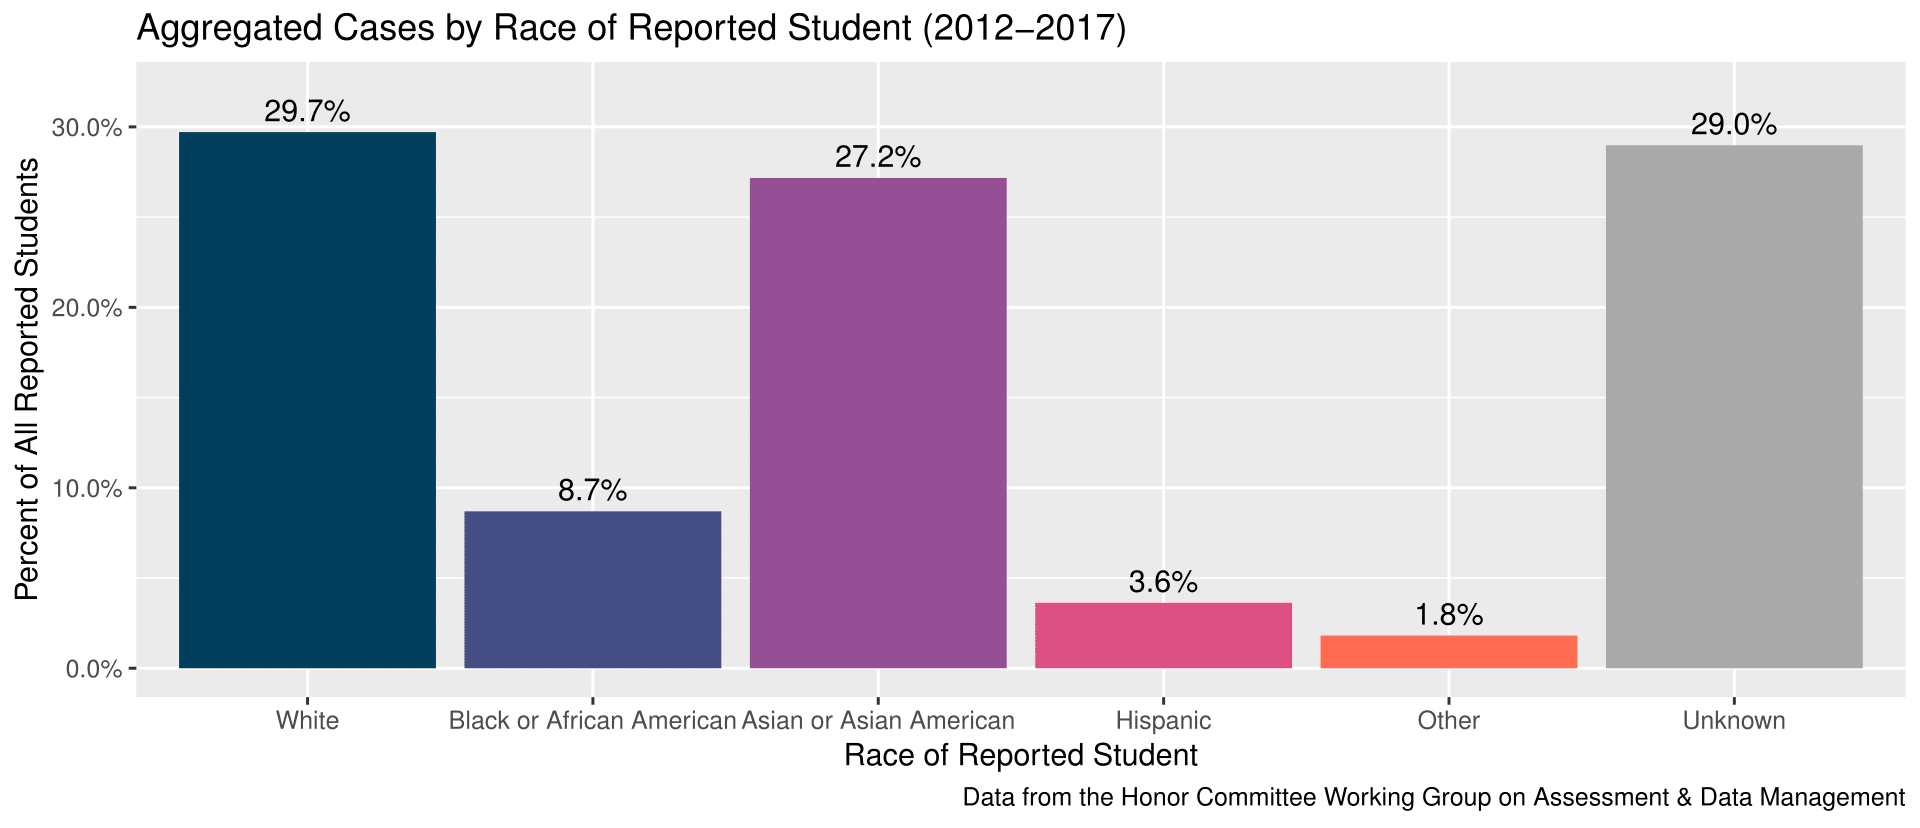
8. Reported student demographics do not mirror UVA demographics.
Race demographics contain a substantial proportions of unknowns. Most of the unknown values come from 2012 and 2013. In 2012, more than 50 percent of students did not have a race listed on the internal case management system. Because there are such significant proportions of unknowns, we cannot draw conclusions about relative size, given that the unknown proportion could change the relation metric between two racial groups.
White students are underrepresented among students reported to Honor. White students make up 29.7 percent of students reported to Honor, but were 58 percent of all enrolled UVA students in 2017. Asian students are significantly over-represented among students reported to Honor relative to their representation at the University. Asian students constitute at least 27.1 percent of reported students but are 12 percent of the UVA domestic student population (for whom race is identified by the IPEDS standards), a difference of 15.1 percentage points. Black students are over-represented by 2.7 percentage points, at 8.7 percent of reported students and 6 percent of UVA students. Hispanic students are underrepresented, making up 6 percent of UVA students but 3.6 percent of reported students.
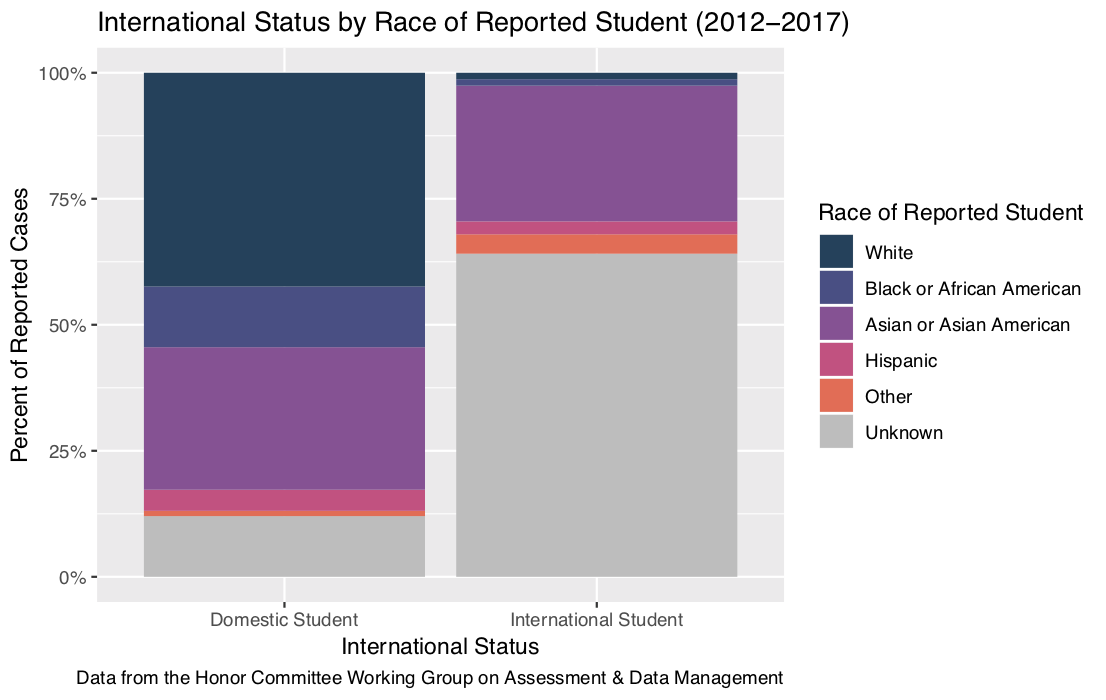
Most students with race unknown are international students. The following figure gives useful insight into the distribution of students with unknown race. A significant proportion of students with race unknown are international students. For the international students with race known, nearly all are Asian students. UVA follows the Integrated Postsecondary Education Data System (IPEDS) standards and does not publish racial demographics for international students, instead grouping them all together as 'Non-Resident Alien' but we hope to gain a better understanding through a future analysis of self identified demographic data.
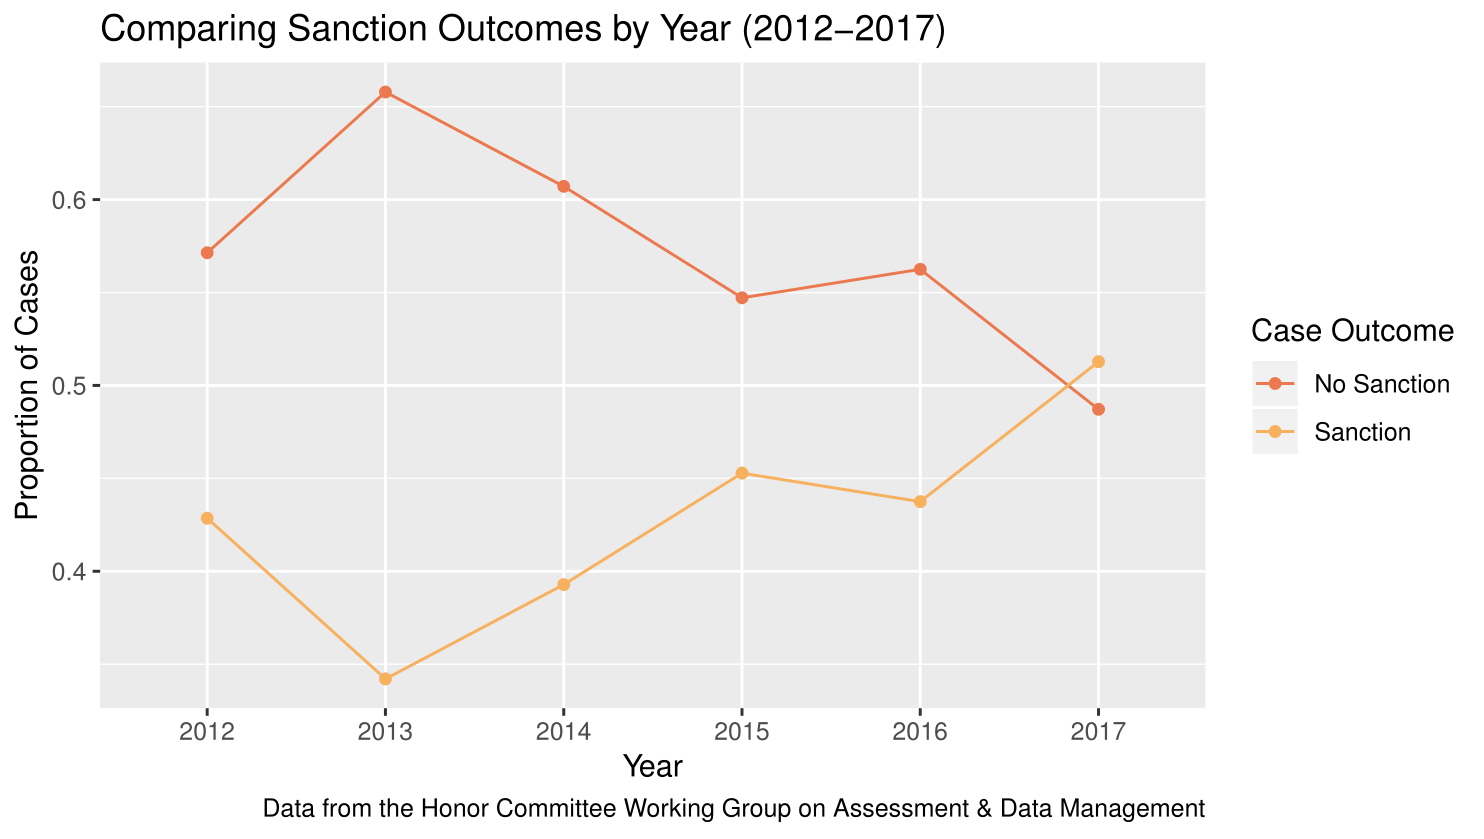
9. A higher percentage of reported students were sanctioned after the passage of the Informed Retraction.
The percent of students who received some type of sanction has consistently increased over the past five years beginning in 2013 with the passing of the Informed Retraction, suggesting that the IR may ensure that more students face some sort of sanction. The figure below shows shows that 2017 was the first year under study in which more students faced a sanction (IR, Guilty, or LAG) than did not face a sanction (I-Panel Drop, Administrative Drop, Not Guilty).
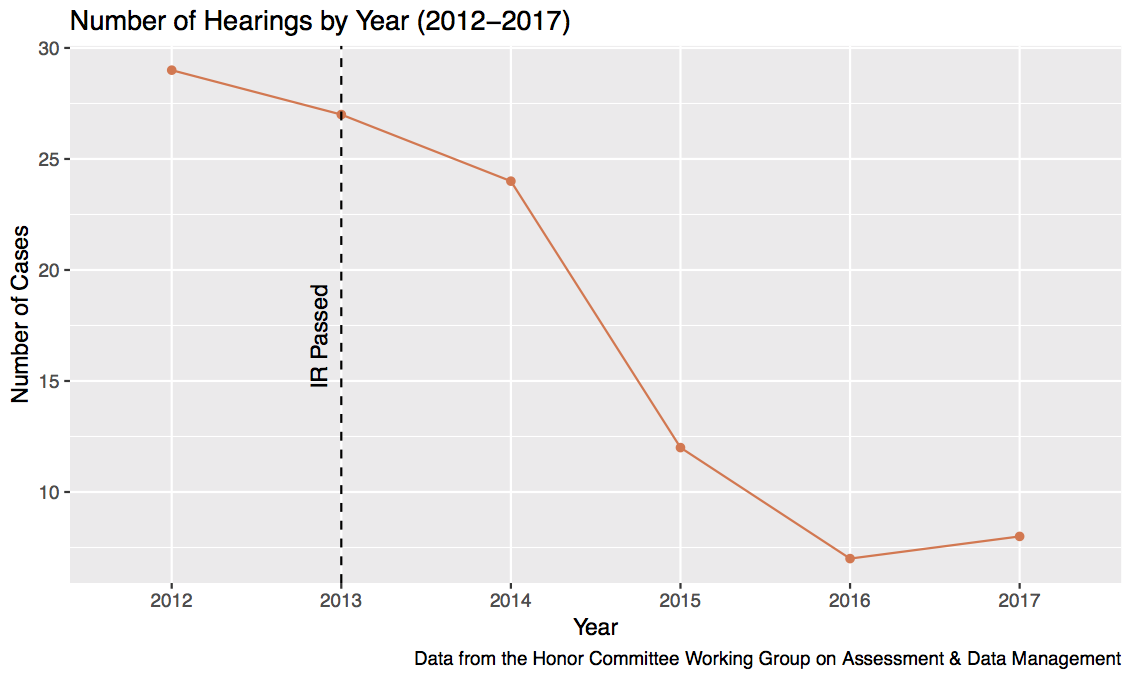
10. There were fewer hearings per year after the passage of the Informed Retraction.
Another effect of the Informed Retraction is seen in the number of hearings per year. Before the IR, 25 to 30 cases per year were sent to a hearing. In 2016 and 2017, less than 10 cases per year were sent to a hearing.
11. Statistical modeling revealed the effects of certain case factors on case outcomes.
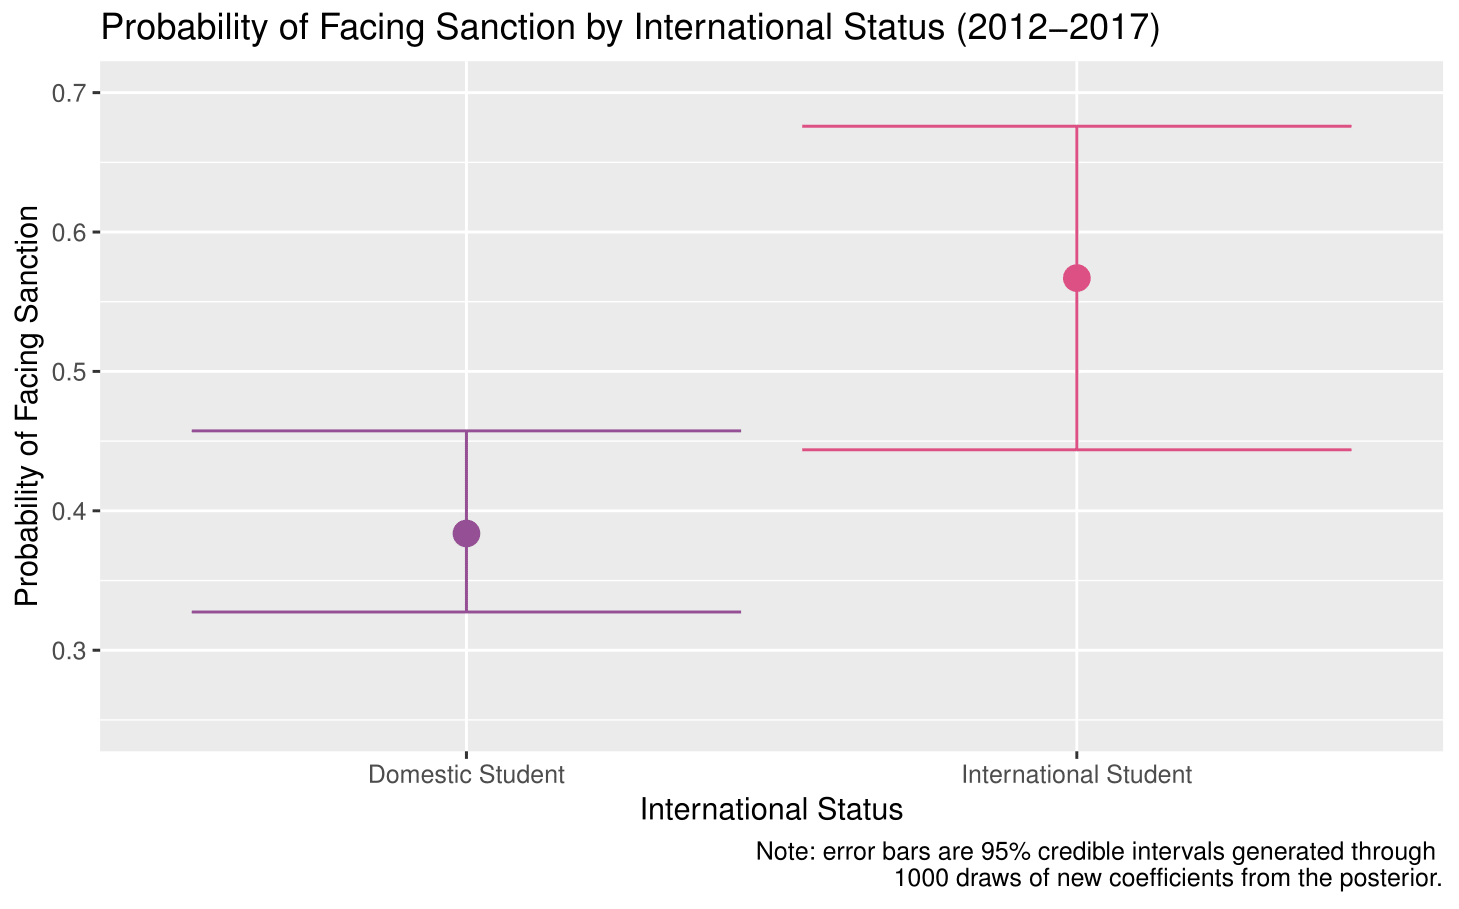
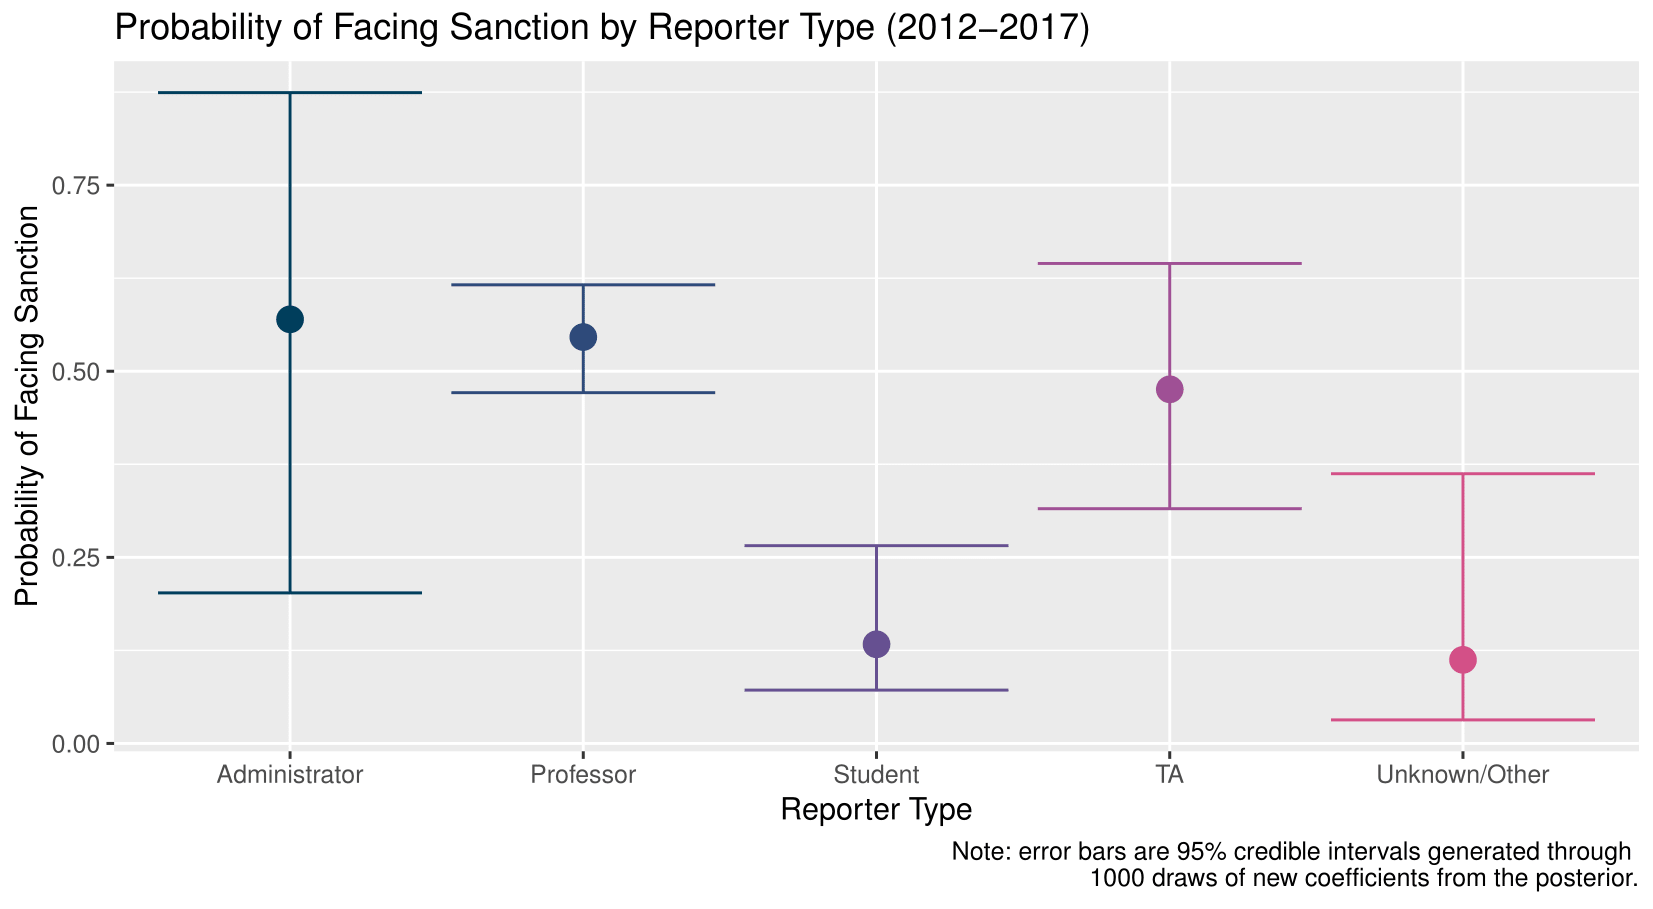
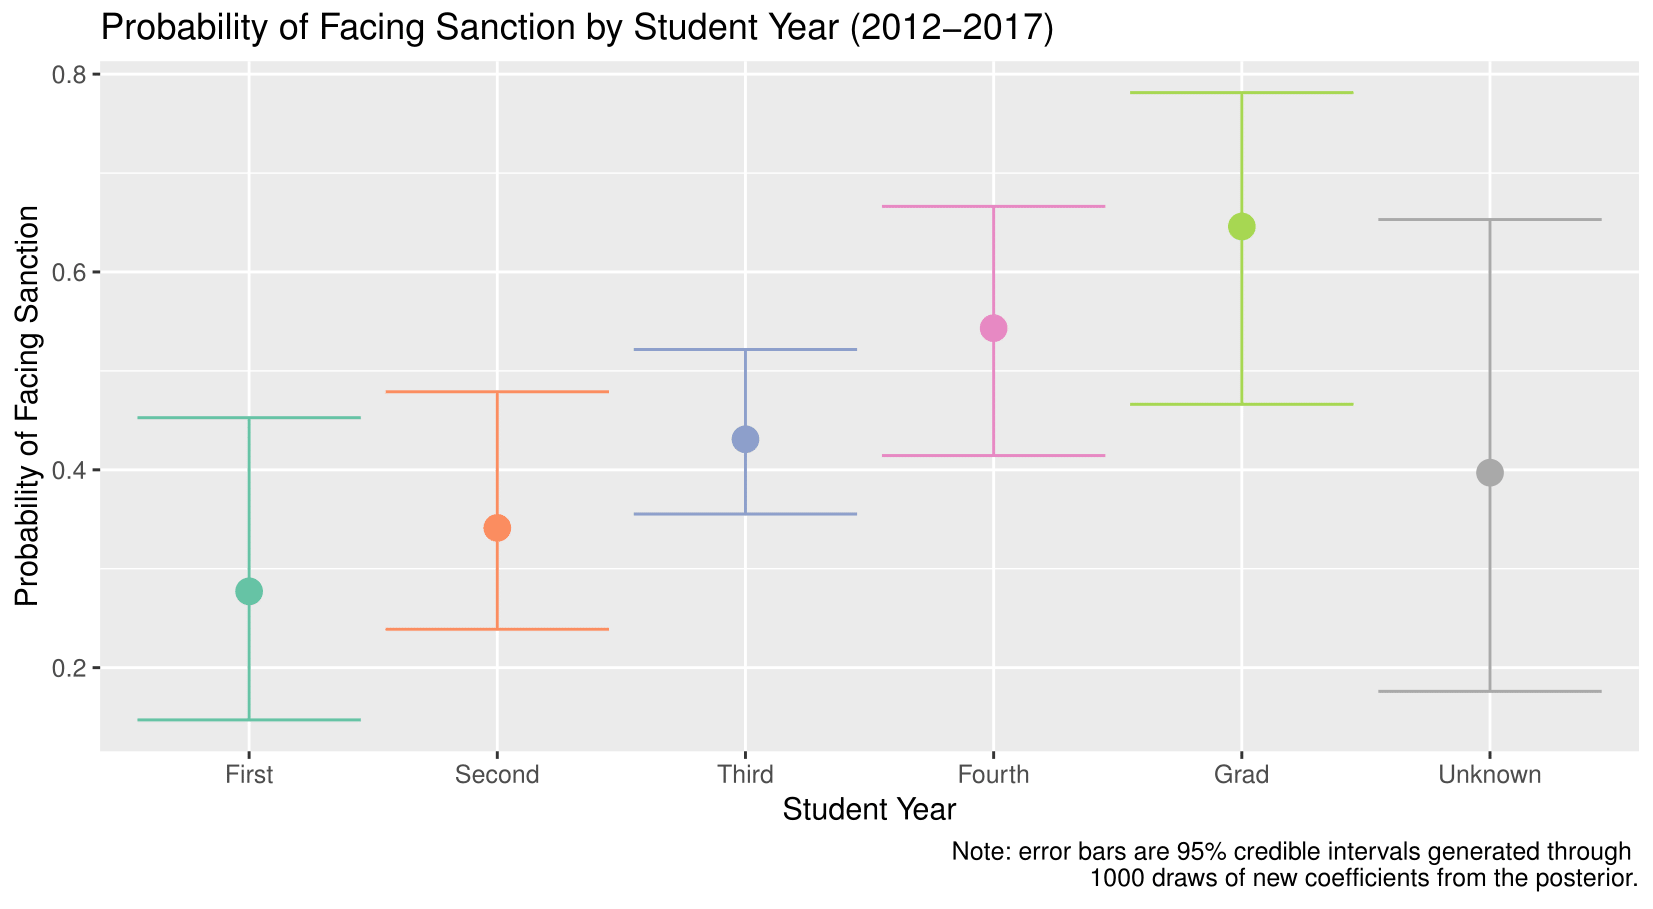
The international status of the reported student, the reported student class year, and the reporter type had statistically significant effects on case outcome. International students were more likely to be sanctioned relative to domestic students. Students reported by faculty were more likely to be sanctioned than students reported by students. Higher year students (fourth years, graduate students) were more likely to be sanctioned than first year students.
There was no statistically significant effect for race, gender, or athlete status on case outcome.
International students were more likely to face a sanction: On average, international students were 18 percentage points more likely to face some sort of sanction outcome than domestic students, after controlling for gender, student year, race, athlete status, and reporter type (p<0.01). Our data also shows that international student made an Informed Retraction more frequently than domestic students, which may contribute to this disparity in sanction outcomes.
Students reported by students were much less likely to face a sanction: Students who were reported by other students, as compared to students who were reported by faculty members, were on average 41 percentage points less likely to face a sanction outcome after controlling for gender, race, athlete status, international status, and student year (p<0.01).
Higher year students were more likely to face a sanction: Fourth year students, as compared to first year students, were 27 percentage points more likely to face a sanction, on average, after controlling for race, gender, international status, athlete status, and reporter type (p<0.05). Graduate students, as compared to first year students, were 37 percentage points more likely to face a sanction, on average, after controlling for race, gender, international status, athlete status, and reporter type(p<0.01). The probability of facing sanction is higher for each year beyond first year. Higher year students were also more likely to make an Informed Retraction than first and second year students.
[1] Boorstein, M. (2002, November 26). U-Va. Expels 48 Students After Plagiarism Probe. Retrieved December 1, 2018, from https://www.washingtonpost.com/archive/local/2002/11/26/u-va-expels-48-students-after-plagiarism-probe/7448e1ac-2e50-45c4-b804-0b437ebfa743/
Note from the Committee Chair: The preceding "At a Glance" analysis, as well as the full-length data report, is the product of Charlotte McClintock, who dedicated hundreds of hours, over many months, to share these truths with the Community of Trust. To Charlotte - as well as the entire Assessment and Data Management Working Group - I offer my deepest gratitude.